Imagine a test has failed. The easiest reaction is to say, “The equipment has a problem!” But what if the real reason is something completely different? At Envitest Laboratories, we like playing engineering detectives. Instead of guessing, we use the Fishbone (Ishikawa) Diagram — one of the most useful tools under our ISO/IEC 17025 quality system — to uncover the real cause.
What Is the Fishbone Diagram?
The Fishbone Diagram, also known as the Ishikawa Diagram, is a structured root cause analysis tool that helps teams explore every possible cause of a problem before reaching a conclusion. The diagram is shaped like a fish skeleton, where each branch represents a category of potential causes — People, Equipment, Methods, Environment, Materials, or Measurement.
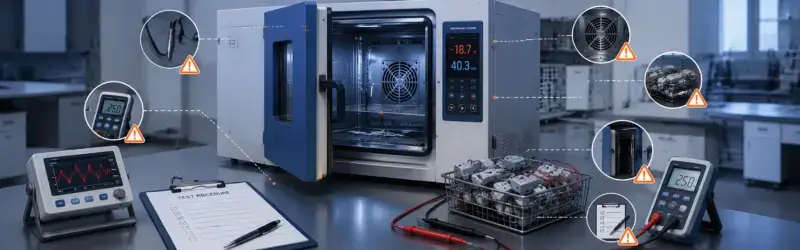
A Real Example: Unstable Temperature Chamber Readings
Take a simple example. A temperature chamber reports unstable readings. Is the chamber faulty? Maybe. But it could also be a loose sensor, incorrect calibration, poor ventilation, an overloaded test sample, an incorrect test method, or even someone accidentally leaving the chamber door slightly open.
Another Example: An EMI Test Suddenly Fails
Or imagine an EMI test suddenly fails. Is the DUT defective? Not necessarily. A forgotten grounding cable, a worn RF connector, a nearby source of interference, or an incorrect setup could all be responsible.
The Fun Part — It’s a Team Exercise
The fun part is that every investigation becomes a team exercise. Engineers gather around a whiteboard, sketch a fishbone, throw in ideas, debate possibilities, eliminate assumptions with evidence, and gradually solve the puzzle.
Every branch of the “fish” represents a possible cause — People, Equipment, Methods, Environment, Materials, or Measurement. Each one is explored systematically until the root cause is identified with confidence.

What ISO/IEC 17025 Expects
This is exactly what ISO/IEC 17025 expects from a competent laboratory — not quick assumptions, but structured, evidence-based root cause analysis that leads to effective corrective actions. A laboratory that investigates thoroughly and documents its findings properly is one that continuously improves its processes and maintains the highest levels of testing accuracy and reliability.
The Envitest Approach
At Envitest Laboratories, every problem is a chance to learn. We don’t just fix issues — we understand them. Because the real goal isn’t to find who made the mistake; it’s to discover why it happened, prevent it from happening again, and continuously improve the quality and reliability of our testing services.
Final Thoughts
The Fishbone Diagram is more than just a quality tool. At Envitest Laboratories, it is part of a culture of curiosity, collaboration, and continuous improvement. Every failed test, every unexpected result, and every anomaly is an opportunity to ask better questions, find better answers, and deliver better testing services.
Because in a laboratory environment, structured thinking is not just a best practice — it is the foundation of reliable results.